IndyCar: Series TV viewership down slightly in 2022 (Update)
Calling BS on the NBC press release that Total Audience Delivery (TAD) was an average of 1.3 million viewers per race of the 16-race 2022 season.
Below we show 1.071 million TV viewers per race based on Nielsen data. In order to get to 1.3 million viewers per race, 228,000 would have had to have streamed each race.
The Indy 500 had 218,800 streamers. To say all the other races had 228,000 people streaming each race is just not believable.
NBC claims TAD is based on Nielsen and Adobe Analytics. We suspect the Adobe Analytics are seriously flawed.
NBC provides no data to back up their claim, whereas we provide detailed data below. Putting out a press release with unsubstantiated numbers does not make it so.
Waiting for NBC to provide the Adobe Analytic data which we find very suspect.
September 13, 2022
The final TV numbers are in for the 2022 IndyCar Series and while the series was looking for growth, it instead shrank slightly – i.e. 3% – despite more race being broadcast on linear over-the-air TV channel NBC.
The average number of viewers tuned in that were in the all-important 18-49 age bracket was 22.65% in 2021 compared to only 21.8% in 2022, indicating that the IndyCar fans are getting older, something that has to keep the suits in the front office up at nights.
The analysis below lays out all the details, but does not include the minuscule Peacock Streaming Viewership numbers, since Peacock does not publish them.
Why? Because it’s likely they are horrible, but that is a guess on our part because Peacock keeps them under wraps. Hence they are excluded for both 2021 and 2022.
| Venue | 2021 Network | 2021 Rating | 2021 Viewers | 2021 18-49 | % 18-49 age bracket |
2022 Network | 2022 Rating | 2022 Viewers | 2022 18-49 | % 18-49 age bracket |
| St. Pete | NBC | 0.77 | 1,219,000 | 290,000 | NBC | 0.89 | 1,405,000 | 337,000 | ||
| Barber | NBC | 0.59 | 914,000 | 257,000 | NBC | 0.59 | 920,000 | 193,000 | ||
| Long Beach | NBCSN | 0.21 | 368,000 | 78,000 | NBC | 0.64 | 1,055,000 | 294,000 | ||
| Indy GP | NBC | 0.64 | 1,024,000 | 229,000 | NBC | 0.60 | 998,000 | 232,000 | ||
| Indy 500 | NBC | 3.15 | 5,547,000 | 1,125,000 | NBC | 2.69 | 4,618,000 | 914,000 | ||
| Detroit 1 | NBC | 0.53 | 842,000 | 193,000 | USA | 0.23 | 354,000 | 94,000 | ||
| Detroit 2 | NBC | 1.11 | 1,383,000 | 363,000 | – | – | – | – | ||
| Texas 1 | NBCSN | 0.22 | 358,000 | 77,000 | NBC | 0.62 | 954,000 | 211,000 | ||
| Texas 2 | NBCSN | 0.24 | 407,000 | 98,000 | – | – | – | – | ||
| Elkhart Lake 1 | NBCSN | 0.47 | 800,000 | 164,000 | NBC | 0.69 | 1,087,000 | 208,000 | ||
| Mid-Ohio | NBC | 0.87 | 1,298,000 | 295,000 | NBC | 0.57 | 877,000.00 | 213,000 | ||
| Toronto | – | – | – | – | Peacock (est) | 0.01 | 5,000 | 1,000 | ||
| Iowa 1 | – | – | – | – | NBC | 0.61 | 941,000 | 186,000 | ||
| Iowa 2 | – | – | – | – | NBC | 0.45 | 719,000 | 114,000 | ||
| Indy GP 2 | NBCSN | 0.30 | 502,000 | 141,000 | NBC | 0.67 | 1,046,000 | 233,000 | ||
| Nashville | NBCSN | 0.68 | 1,200,000 | 288,000 | NBC/CNBC | 0.09 | 121,000 | 24,000 | ||
| Gateway | NBCSN | 0.25 | 434,000 | 103,000 | USA | 0.34 | 553,000 | 138,000 | ||
| Portland | NBC | 0.43 | 666,000 | 124,000 | NBC | 0.61 | 979,000 | 208,000 | ||
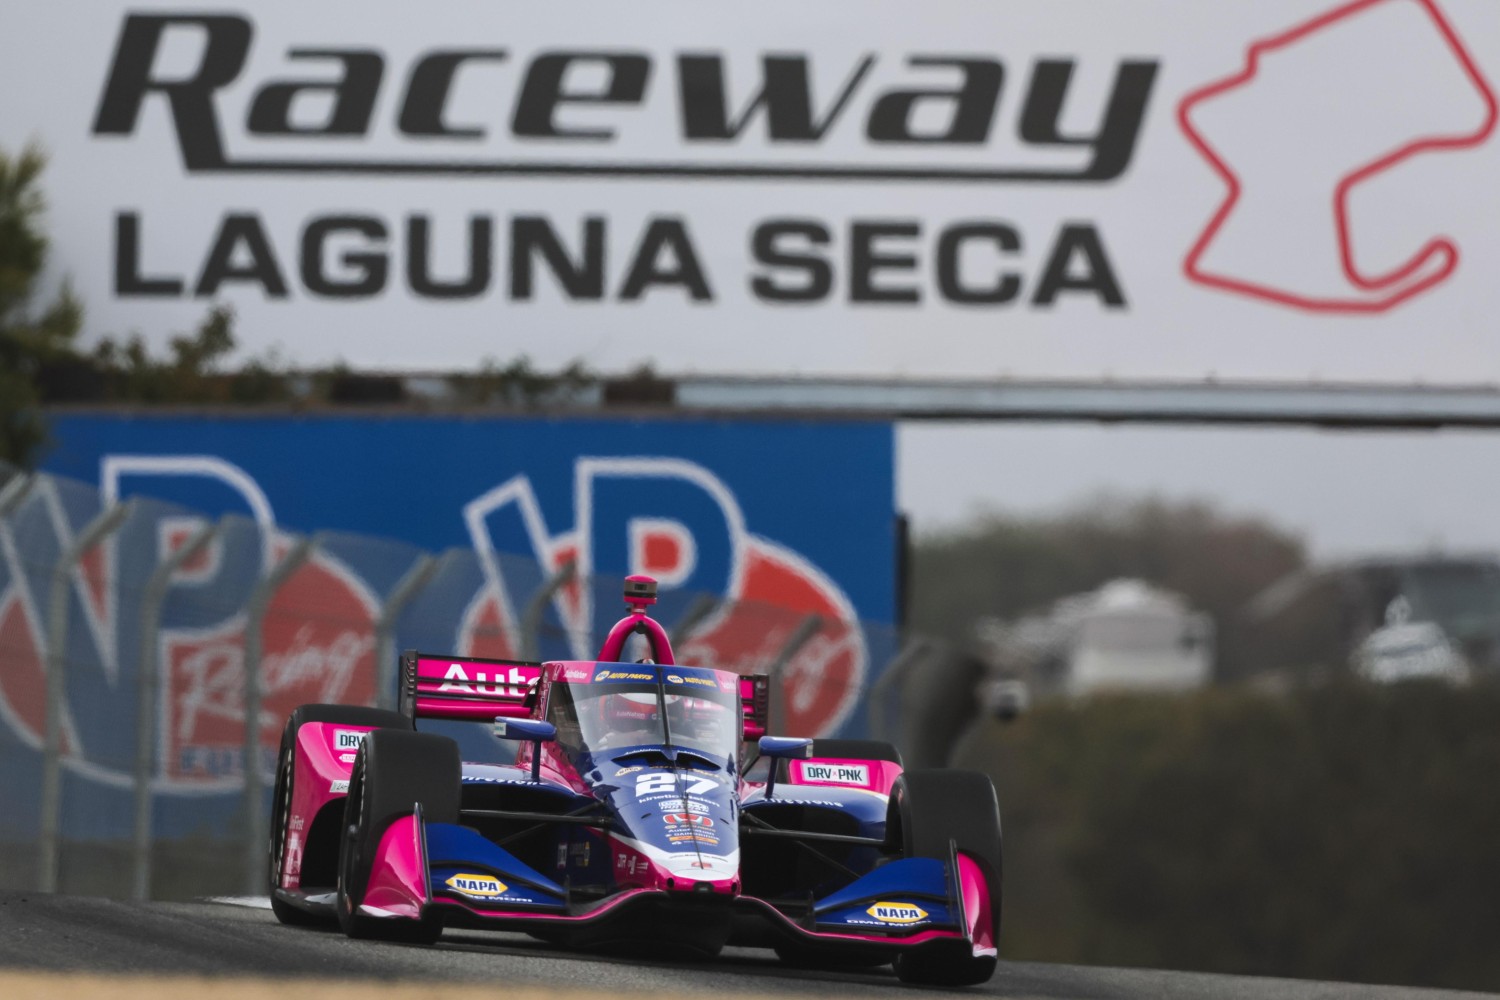
| Laguna Seca | NBC | 0.44 | 715,000 | 179,000 | NBC | 0.32 | 507,000 | 137,000 | ||
| Annual Total | 17,677,000 | 4,004,000 | 22.65% | 17,139,000 | 3,737,000 | 21.8% | ||||
| % Chg | -3.0% |
