Historical Indy 500 TV Ratings
Below is a table of historical IndyCar TV Ratings. Oh how we long for those CART days – the series Tony George set out to destroy. With the help of Fred Nation, ultimately they were successful.
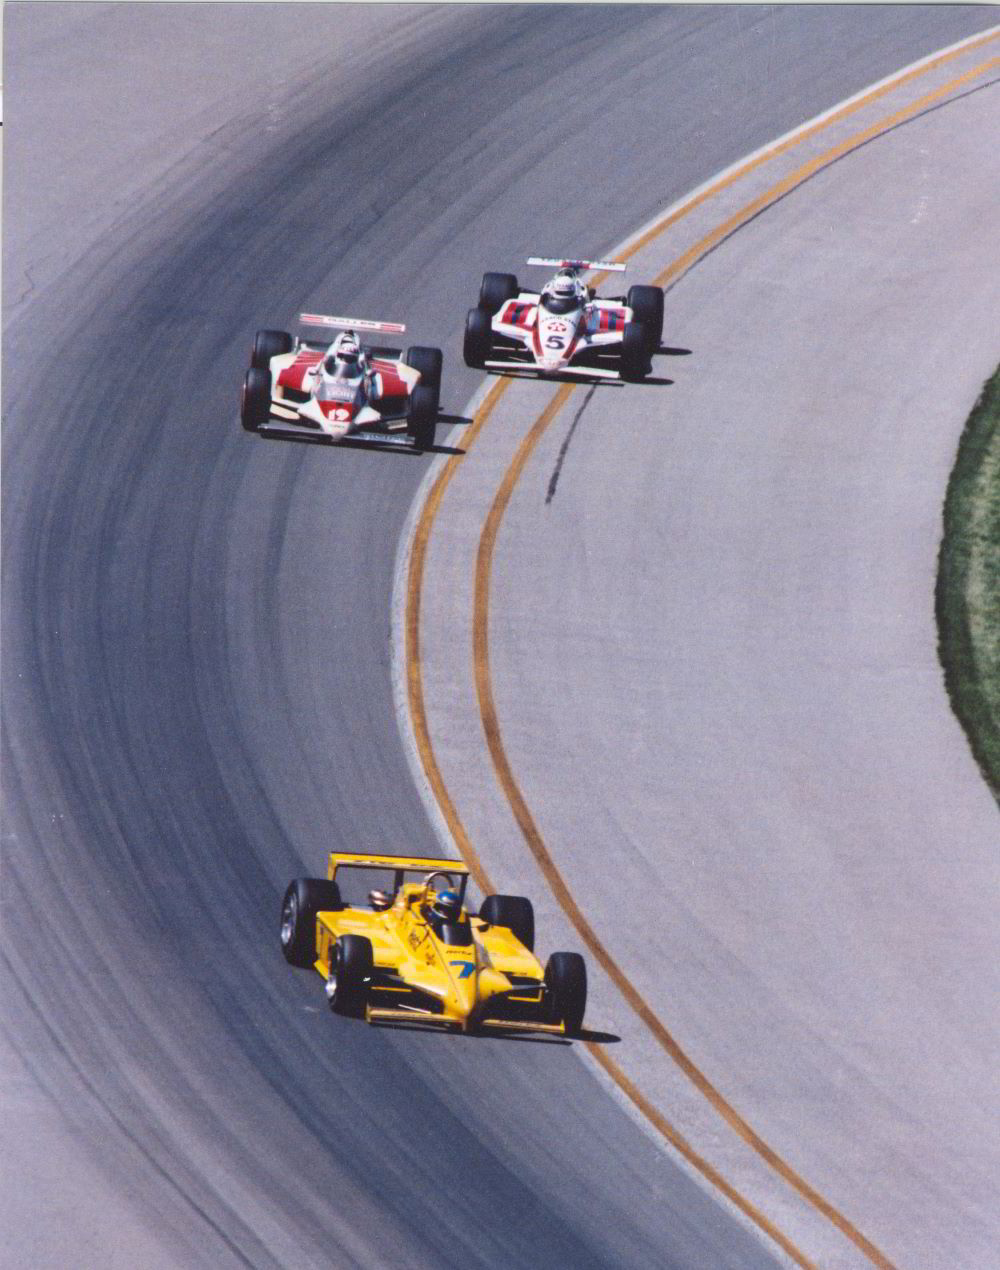
The highest Indy 500 TV Rating in the modern era was a 14.1 in 1983 (pictured above) on ABC in the CART Golden Years
It will define Tony George’s legacy while Fred Nation has returned to behind the scenes democratic party politics.
| Year | TV Rating | Share | Net | League | Comment |
| 1979 | 13.5 | 24 Share | ABC | CART | CART’s 1st Year |
| 1980 | 13.8 | 27 Share | ABC | CART | IndyCar’s Golden Years |
| 1981 | 12.8 | 24 Share | ABC | CART | IndyCar’s Golden Years |
| 1982 | 12.3 | 25 Share | ABC | CART | IndyCar’s Golden Years |
| 1983 | 14.1 | 27 Share | ABC | CART | IndyCar’s Golden Years |
| 1984 | 12.9 | 25 Share | ABC | CART | IndyCar’s Golden Years |
| 1985 | 9.7 | 18 Share | ABC | CART | IndyCar’s Golden Years |
| 1986 | 8.8 | 31 Share | ABC | CART | IndyCar’s Golden Years |
| 1987 | 11.1 | 36 Share | ABC | CART | IndyCar’s Golden Years |
| 1988 | 8.5 | 29 Share | ABC | CART | IndyCar’s Golden Years |
| 1989 | 7.8 | 28 Share | ABC | CART | IndyCar’s Golden Years |
| 1990 | 7.4 | 26 Share | ABC | CART | IndyCar’s Golden Years |
| 1991 | 8.0 | 27 Share | ABC | CART | IndyCar’s Golden Years |
| 1992 | 9.8 | 31 Share | ABC | CART | IndyCar’s Golden Years |
| 1993 | 9.3 | 31 Share | ABC | CART | IndyCar’s Golden Years |
| 1994 | 9.1 | 31 Share | ABC | CART | IndyCar’s Golden Years |
| 1995 | 9.4 | 26 Share | ABC | CART | IndyCar’s Golden Years |
| 1996 | 6.6 | 19 Share | ABC | IRL | T. George destruction begins |
| 1997 | 5.1 | 14 Share | ABC | IRL | Rating falls below 6.0 |
| 1998 | 6.0 | 19 Share | ABC | IRL | T. George damage continues |
| 1999 | 5.5 | 18 Share | ABC | IRL | T. George damage continues |
| 2000 | 5.5 | 15 Share | ABC | IRL | T. George damage continues |
| 2001 | 5.8 | 17 Share | ABC | IRL | T. George damage continues |
| 2002 | 4.8 | 15 Share | ABC | IRL | Rating falls below 5.0 |
| 2003 | 4.6 | 14 Share | ABC | IRL | T. George damage continues |
| 2004 | 4.7 | 11 Share | ABC | IRL | T. George damage continues |
| 2005 | 6.5 | 18 Share | ABC | IRL | Some CART Teams Participate |
| 2006 | 5.0 | 14 Share | ABC | IRL | T. George damage continues |
| 2007 | 4.3 | 12 Share | ABC | IRL | CART/IRL Merger deal done |
| 2008 | 4.5 | ?? Share | ABC | IRL | A small bump up after merger |
| 2009 | 4.0 | 11 Share | ABC | IRL | Merger can’t overcome T. George damage |
| Year | TV Rating | Viewers | Net | League | Comment |
| 2010 | 3.6 | 10 Share 5.79M | ABC | IRL | Rating falls below 4.0, <10% of Households |
| 2011 | 4.0 | 6.71M | ABC | IndyCar | T. George damage continues |
| 2012 | 4.34 | 6.86M | ABC | IndyCar | T. George damage continues |
| 2013 | 3.7 | 5.74M | ABC | IndyCar | Viewership falls below 6.0M |
| 2014 | 3.8 | 5.94M | ABC | IndyCar | T. George damage continues |
| 2015 | 4.1 | 6.4M | ABC | IndyCar | T. George damage continues |
| 2016 | 3.8 | 5.86M | ABC | IndyCar | T. George damage continues |
| 2017 | 3.41 | 5.457M | ABC | IndyCar | T. George damage continues |
| 2018 | 3.08 | 4.91M | ABC | IndyCar | T. George damage continues |
| 2019 | 3.41 | 5.414M + 32K Streaming | NBC | IndyCar | First Year for NBC, equals ABC in 2017 |
| 2020 | 2.3 | 3.737M | NBC | IndyCar | Down 32.3% |
Notes:
2020 Still overnight rating. Finals not in yet
Share = % USA Households Watching TV that are watching race
