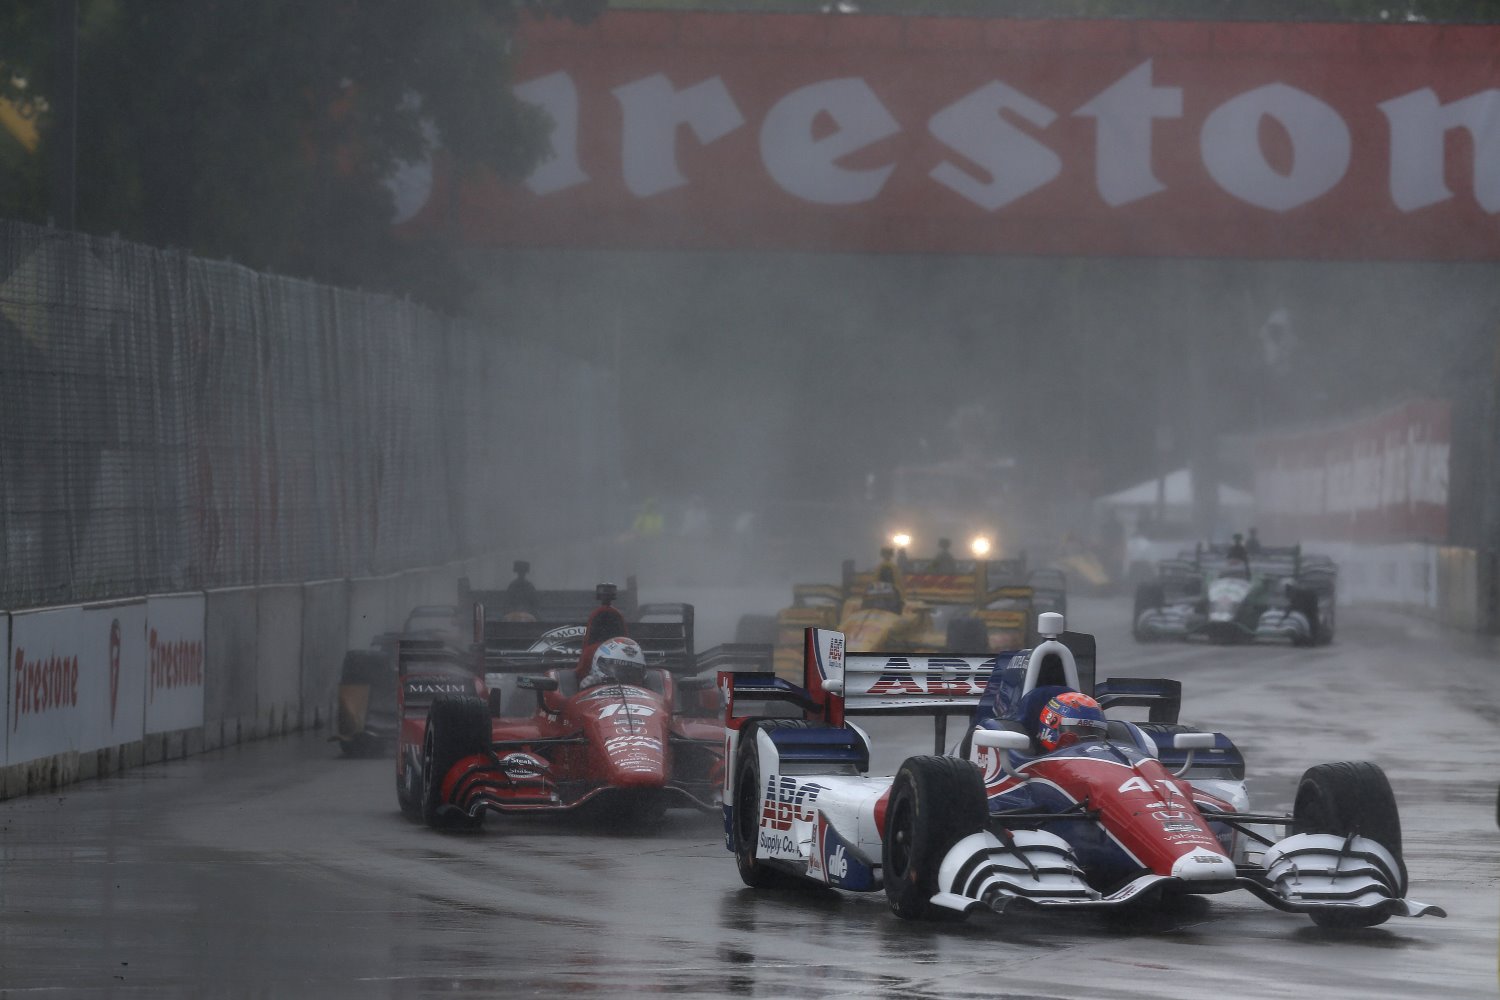
IndyCar TV Ratings through 10 races
 |
| Despite some very good racing, IndyCar is struggling to draw viewers |
Below, are television ratings for the Verizon IndyCar Series through 12 broadcast events in 2015 (10 races and two days of Indianapolis 500 qualifying). For comparison sake, we have put the television viewership numbers of the 2014 race with their respective 2015 races.
While we probably don't need to tell you that the picture isn't pretty, we will share a few quick notes:
-Viewership for the four non-Indianapolis 500 races on network television (ABC) are 199% better than the races on NBC Sports Network.
-through 10 2015 races (half on ABC, half on NBCSN) 86% of IndyCar's race viewership has come via network television. This percentage goes up if you include qualifying for the Indianapolis 500.
-Aggregate television viewership through these 12 events (again 10 races and the two Indy 500 qualifying days on ABC) is down about 7%.
|
Race |
Network | 2014 Rating | 2014 Viewership | 2015 Rating | 2015 Viewership | % change (if applicable) |
| St. Petersburg | ABC | 0.6 | 860,000 | 0.6 | 891,000 | +3% |
| NOLA | NBCSN | N/A | N/A | 0.2 | 253,000 | N/A |
| Long Beach | NBCSN | 0.3 | 368,000 | 0.3 | 344,000 | -7% |
| Barber | NBCSN | — | 400,000 | 0.25 | 300,000 | -25% |
| GP Indy | ABC | 0.9 | 1.2 million | 0.7 | 1.0 million | -20% |
| Sat. Indy 500 qualifying | ABC | 0.7 | 1.1 million | 0.5 | 791,000 | -28% |
| Sun. Indy 500 qualifying | ABC | 1.0 | 1.5 million | 0.8 | 1.1 million | -27% |
| Sun. Indy 500 qualifying | ESPNNEWS | N/A | N/A | 0.1 | 195,000 | N/A |
| Indy 500 | ABC | 3.9 | 6.1 million | 4.2 | 6.5 million | +7% |
| Detroit 1 | ABC | 0.9 | 1.4 million | –0.7 | 845,000 | -40% |
| Detroit 2 | ABC | 0.7 | 1.0 million | 1.0 | 1.16 million | +16% |
| Texas | NBCSN | 0.4 | 424,000 | 0.37 | 431,000 | +1.6% |
| Toronto | CNBC/NBCSN | 0.1 – Race 1 0.4 – Race 2 | 128,000 488,000 | 0.25 (overnight) | 300,000 (estimate, final numbers not out yet) | ***See below |
AR1 Staff Report
